Node Editor
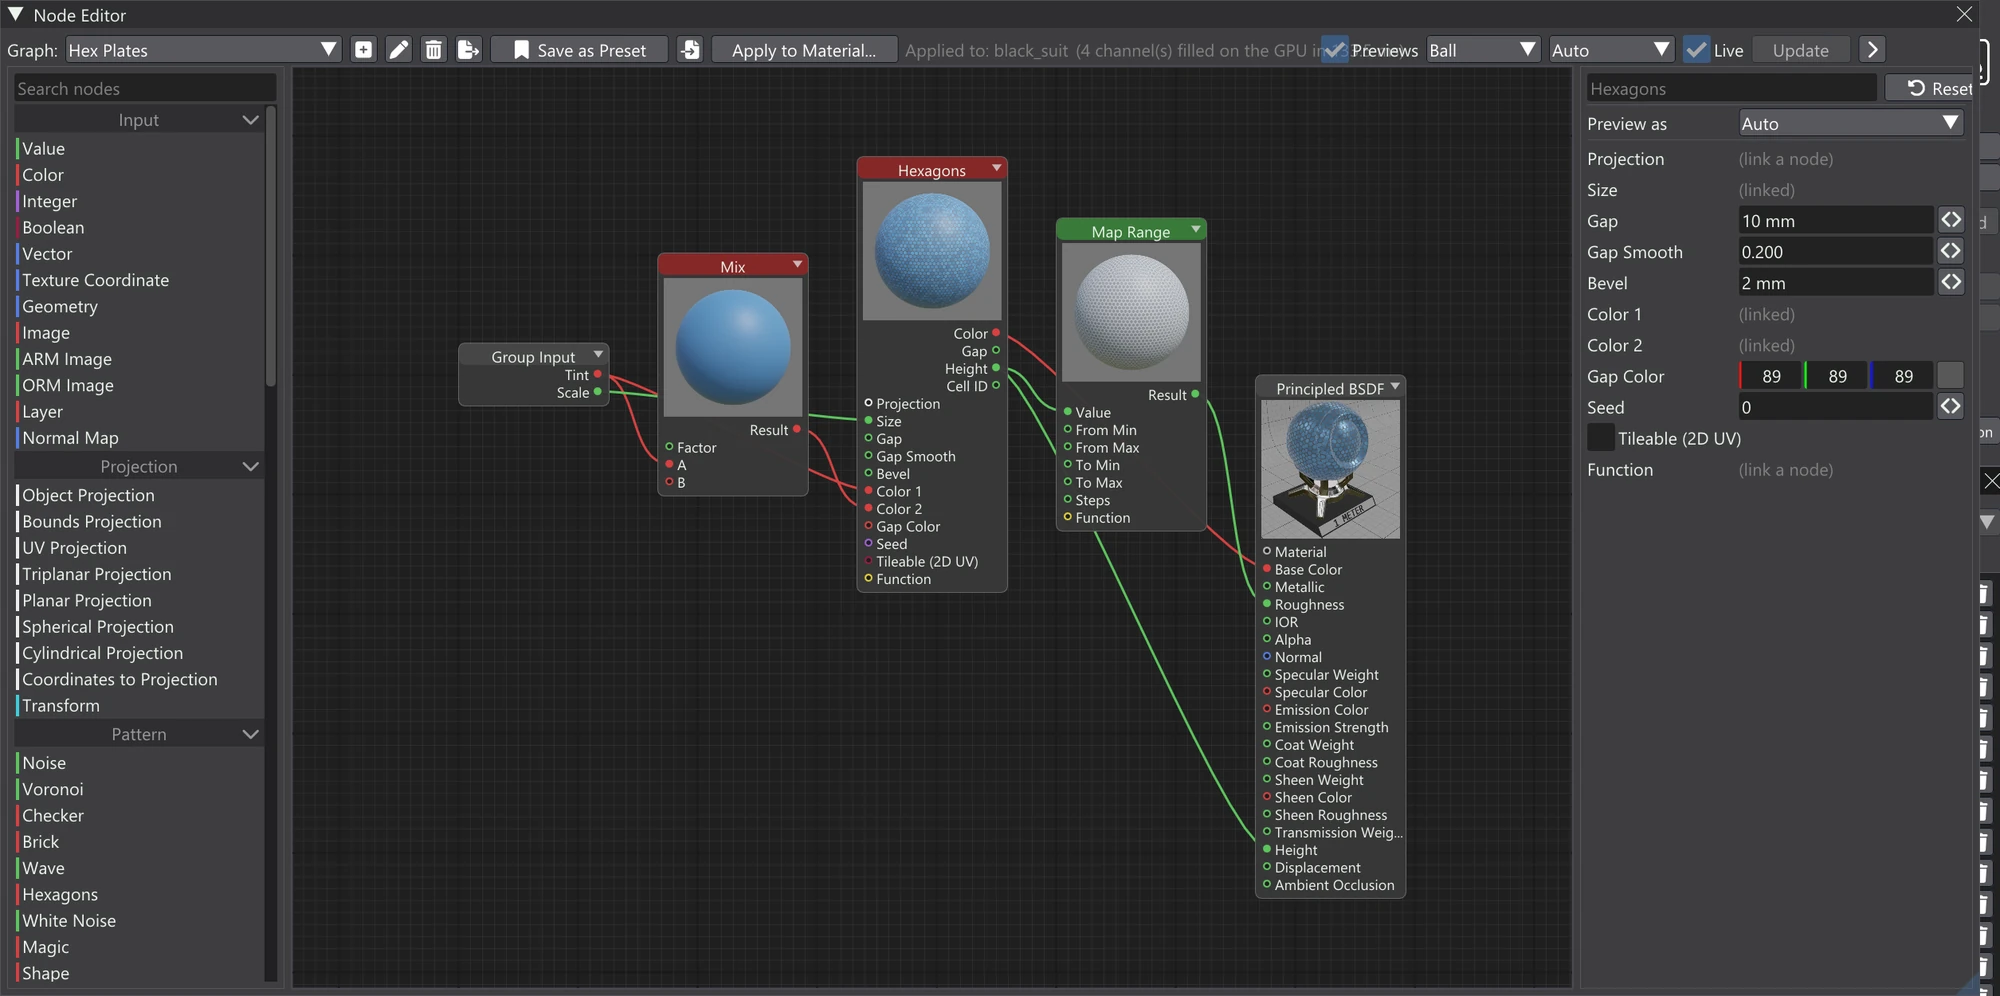
The Node Editor is where node graphs are built. Open it from Window → Node Editor. It is a window of its own and never docks. Along the top runs the graph strip; below it, the node list on the left, the canvas in the middle and the settings sidebar on the right.
The graph strip
A project can hold any number of graphs; the strip along the top chooses which one is on the canvas and acts on it.
| Control | What it does |
|---|---|
| Graph: | The graph shown on the canvas. Pick another from the list to switch. |
| + | A new graph with a Principled BSDF output, ready for nodes. |
| Pen | Rename this graph. |
| Bin | Delete this graph. If it is applied to materials, the confirmation says how many. |
| Export / Import | Export this graph as a .vxn file (its images travel inside it, packed as JPEG XL where that
makes them smaller: lossless for PNG, TGA, TIFF and BMP images, 16-bit ones included; a JPEG used as
data is repacked without any further loss, a colour JPEG re-compressed at high quality; files from older versions, which packed images as WebP, still open), or import a
graph from one. |
| Apply to Material... | Add this graph to a material's layers as a Node Layer. Needs a loaded model with a UV map. Once applied, the strip shows Applied to: and the material names. |
| Previews | Show each node's result on a ball. Hover a preview for a larger view. |
| Ball / Flat / Windowed | What previews are drawn on: Ball shows each node lit on a sphere; Flat shows the raw values on a square, which is best for masks and tiling. Saved with the graph. Windowed opens the Node Material Preview window, and the nodes keep their Ball or Flat previews. Picking Ball or Flat again closes the window. |
| Live | Refill the graph's Node Layers as you edit. Off: only when you press Update. |
| Update | Refill the graph's Node Layers now. Available while Live is off. |
| Chevron | Open or close the settings sidebar. While it is closed, node settings open in a Node Settings popup instead. |
The File menu also has Export Node Graph... (the graph open in
the Node Editor, as a .vxn file) and Import Node Graph..., which
brings a .vxn in as a new graph.
Adding nodes
The list on the left holds every node, grouped by category — Input, Projection, Pattern, Color, Function, Math, Vector, Filter, Mesh and Material. Type in Search nodes to narrow it; while searching, every category with a match is listed flat. Then:
- Double-click a node in the list to add it in the middle of the view. A single click does nothing, so you can browse without adding nodes by accident.
- Drag it onto the canvas to drop it where you let go.
- With the mouse over the canvas, press Tab or Space for the Add node... search at the cursor. Type, then click a result, or press Enter to add the first match.
- Right-click empty canvas (with nothing selected) and use Add Node, which lists the same categories.
However it is added, the new node becomes the active one. It is selected on its own, and when the settings sidebar is open, the sidebar shows its settings straight away.
A tile dragged from the Node Presets window onto the canvas is inserted as a group. See Node Presets.
Linking sockets
Drag from a node's output socket to another node's input to link them. Sockets are coloured by the kind of value they carry, and a link is only made between sockets that can carry the same kind of value, and never one that would loop back on itself. You do not have to hit the dot exactly: drop the link anywhere on a node and it connects to the input nearest the cursor's height.
To remove a link, press on its string, or on the input dot it feeds, and drag: the link comes off and follows the mouse as a loose link from the same output. Drop it on another input to reconnect it there, or release anywhere else and it is gone.
Editing a node's settings
Double-click a node to edit its settings in the sidebar (or in the Node Settings popup when the sidebar is closed). With one node selected, the right-click menu's Settings... does the same. Double-clicking a group node opens the group instead — see Groups & Exposed Parameters.
The field at the top is the node's name on the canvas. Leave it empty to show its type. Below it come the node's parameters, then its inputs. An input that is linked shows (linked) instead of a value, because the link supplies it.
A number slider shows a useful range, not a limit: a typed or stepped value may go past the slider's maximum, so typing 3.75 into a field whose slider ends at 2 gives 3.75. The minimum still holds.
With no node open, the sidebar shows the graph's Exposed parameters instead. See Groups & Exposed Parameters.
Previews and Preview as
With Previews on, each node shows its result, on a ball or flat as chosen in the graph strip. While you type a value, previews and Node Layers wait until you press Enter or Tab or click away; dragging a slider stays live.
Preview as, in a node's settings, chooses how its preview reads the node's value: Auto picks by the value's type, or read it as Color, Roughness, Metallic, Normal or Emission. It only changes the picture, not the graph's output.
The Node Material Preview window
Choose Windowed in the graph strip's preview dropdown to open the Node Material Preview. This window shows the whole material on the canvas, large, on a model of your choice. It updates as you edit the graph. It is a window of its own, never docks, and shows while the Node Editor is open.
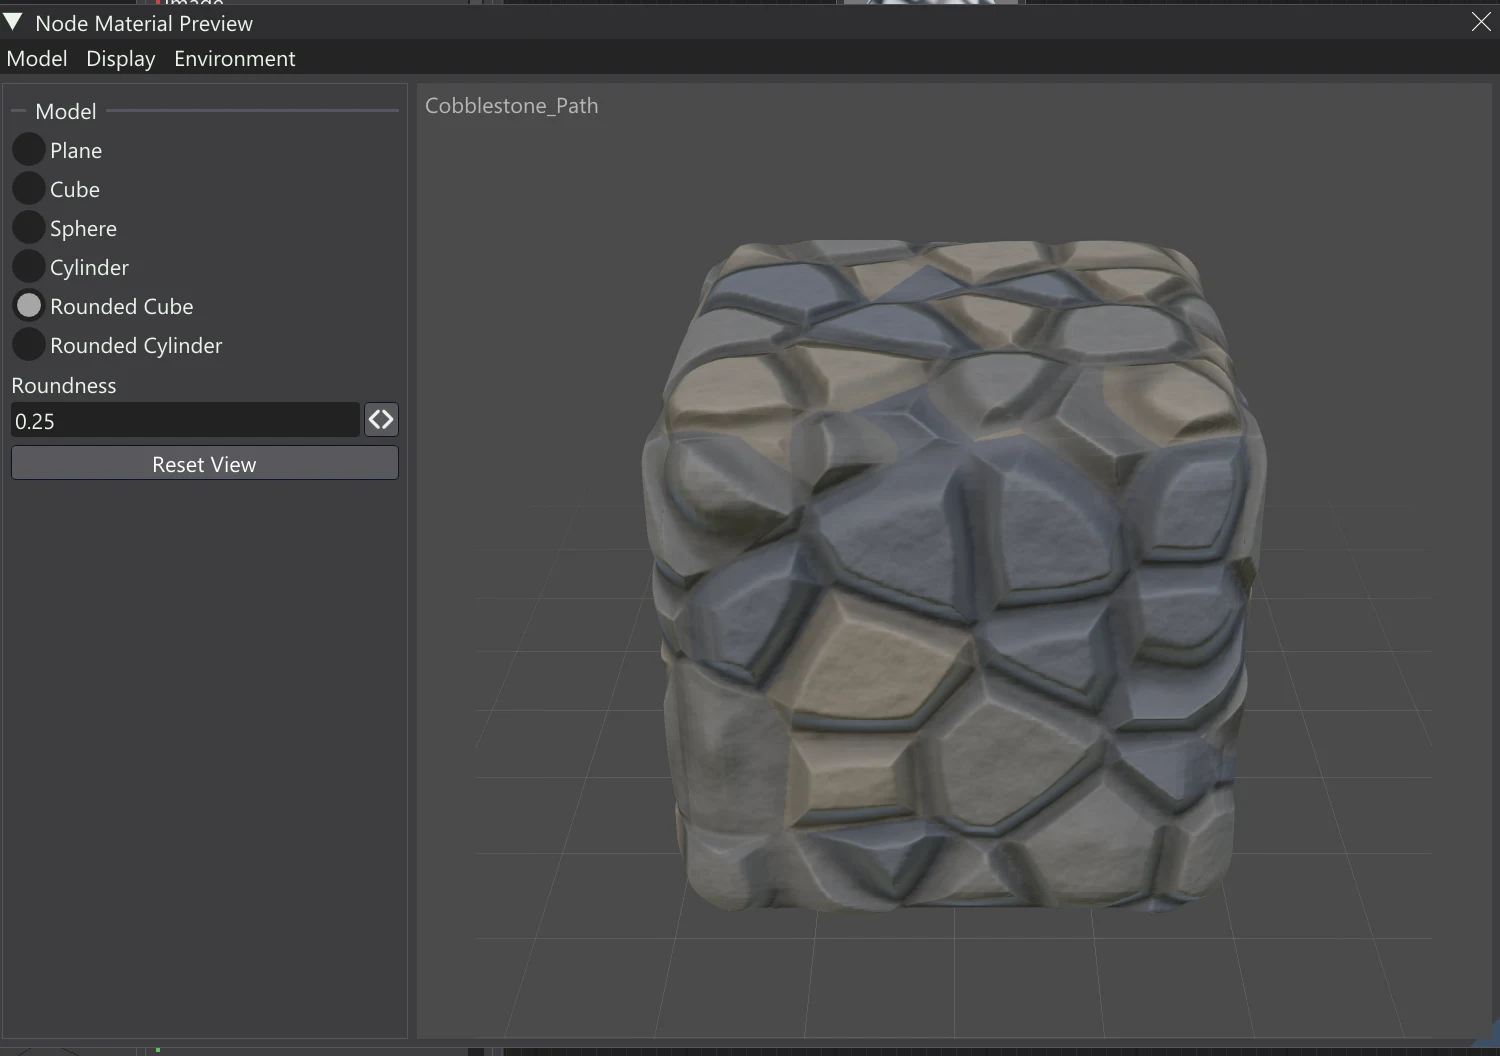
The menu across the top holds the window's settings. Pick an item and its options appear in the sidebar on the left.
| Menu | Items and their options |
|---|---|
| Model | The model the material is shown on: Plane, Cube, Sphere, Cylinder, Rounded Cube or Rounded Cylinder. Roundness sets how round the rounded models' corners are. Reset View puts the camera back. |
| Display | Wireframe: a light cage of lines over the model, with its colour and opacity. Grid: a floor grid under the model, with its opacity. Show OpenGL/PBR Material: switches on the row of channel icons the main view's PBR/OpenGL Layers shows, across the top of the picture. Click an icon to see just that channel of the material (Base Color, Normal Map, Roughness, Ambient Occlusion and the rest), and click it again to go back to the lit view. Icons for channels the material does not have are dimmed. |
| Environment | HDRI: the image that lights the model, Default or Studio, with its intensity and rotation. With Regular and Ultra, Load HDRI... lights it with an HDR image of your own. Light 1 and Light 2: two lights, each with an on/off switch, colour, intensity and direction (around the model, and how high). |
A tick beside Wireframe, Grid, Light 1 or Light 2 in the menu shows it is on.
- The view is always PBR. The HDRI lights the model and shows in its reflections, but it is never shown behind the model.
- These settings belong to this window. Changing them never touches the viewport's own lights, HDRI or display.
- Drag in the view to turn the model, and use the mouse wheel to zoom. Double-click to reset the view.
- Patterns keep their real size, as on the node previews: the model is as big as the loaded model.
Navigating the canvas
| Action | Mouse or key |
|---|---|
| Pan | Middle-drag, or Ctrl+left-drag, from anywhere on the canvas. |
| Zoom | Mouse wheel. |
| Frame all nodes | F, or Frame All in the right-click menu on empty canvas. |
| Tidy the layout | Arrange All in the right-click menu on empty canvas. |
The editor frames all the nodes by itself when it opens and whenever you switch to another graph.
Selecting nodes
- Click a node to select it; click empty canvas to clear the selection.
- Left-drag on empty canvas to draw a selection box. Hold Shift to add the box to what is already selected.
- Shift+click a node to add it to the selection or take it out again.
Deleting, copying and collapsing
Right-click with nodes selected for the node menu, or use the keys while the canvas has focus:
| Command | Key | What it does |
|---|---|---|
| Settings... | Open the selected node's settings (one node only). | |
| Collapse / Expand | Fold the selected nodes down to their title and preview, or open them out again. | |
| Group / Ungroup | Ctrl+G / Ctrl+Shift+G | Wrap the selection in a group node, or unpack one. |
| Duplicate | Ctrl+D | Copy the selection and paste it at the cursor. |
| Copy | Ctrl+C | Copy the selected nodes. |
| Cut | Ctrl+X | Copy, then delete, the selected nodes. |
| Paste | Ctrl+V | Paste at the cursor. |
| Delete | Del | Delete the selected nodes. |
| Undo / Redo | Ctrl+Z / Ctrl+Y or Ctrl+Shift+Z | Step the graph back or forward. The Node Editor keeps its own undo, separate from painting. |
Sending a graph to a material
Press Apply to Material... and choose a material from the list. Vertexix adds a new layer to that material's stack, named after the graph, with a member for each channel the graph drives, and fills it from the graph. From then on, edits refill it: at once with Live on, or when you press Update with it off. See Node Layers.